

INTRODUCTION
Every year, roughly 2.5M students enroll as first year college students, and 61%-62% of high school graduates go straight to college. Parents know that college is expensive and they ask “How do I save?” Better questions might be:
-
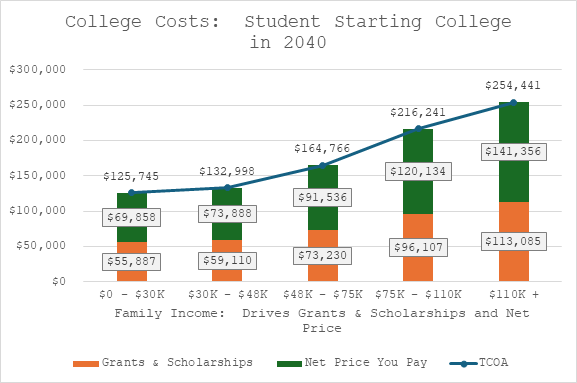
- How much do I have to pay out of pocket? This is a smarter question than, “what is the retail price?” because virtually every college offers Need Based and Merit Based grants and scholarships. That’s free money that reduces your out-of-pocket costs. And it varies tremendously based on your income as shown in the figure below.
| Retail Cost | – Free Money | = Net Price |
| Total Cost of Attending College | Need and Merit Based Grants and Scholarships | Amount you Pay out of pocket |
- What is driving up the cost of college? If you know what is driving up the cost you might be able to do something about it. If it’s government policy, you may be limited in what you can do. But if it’s something else … spoiler alert, it is … then you have options which we describe below.
- How should I finance the balance? The traditional route is to save for 18 years, spend it all in 4 and then you are back where you started at $0. Smarter strategies that build long term wealth combine investments and loans. See the Loan Strategy section in Section 4 for an example of a smart borrowing strategy in mortgages that can be used to help grow wealth while paying for college.
- What happens to my kids education in the event of my death? Most of us don’t want to think about this, but you should. When you buy a car or a house you get car insurance or home insurance. It makes sense to have inexpensive term life insurance covering their education.
COST OF COLLEGE SUMMARY
In most families, the conventional college affordability conversation is fixated on tuition. That fixation is understandable; tuition has been the dominant headline for forty years. But it is increasingly misleading. Over the past decade, inflation-adjusted tuition at public universities has been flat or declining. At many schools, net tuition—what a family actually pays after grants and scholarships—has fallen. Yet families have not felt that college is more affordable, quite the opposite.
The reason is hiding in plain sight: the fastest-growing cost of college is not tuition. It is cost of living.
Room and board rose 14% more than inflation between 2010 and 2020. Nationwide rents have jumped 33% since the pandemic. Student housing rents are growing at double the rate of the broader rental market. And critically, the 18-to-22-year-old does not incur these costs because they attend college. They incur them because they are alive and need shelter and food. A young adult who does not attend college pays nearly identical costs for housing and food in that same four-year window.
This distinction—tuition as a college cost, cost of living as a life cost—reframes everything. It changes what parents should be planning for. It changes what a financial advisor should be recommending. And it changes what constitutes a defensible solution.
This white paper presents the data behind that reframing, traces the historical drivers of college cost by decade, examines the tuition-versus-cost-of-living split in rigorous detail, and outlines an integrated approach to addressing both—because a plan that covers only tuition while ignoring housing, insurance, and loan strategy is not a plan at all.
Key Findings
- Real (inflation-adjusted) tuition at public four-year universities has increased less than 1% since 2010. Net tuition paid by students peaked in 2012-13 and has declined since.
- Room and board is now the largest single expense for in-state students at public universities—exceeding tuition for the first time in history.
- The 18-22 year old pays for housing and food whether or not they attend college. This cost is a life expense that happens to coincide with college attendance.
- Administrative staff at U.S. universities grew 240% from 1975 to 2005 while faculty grew ~50%. Non-instructional spending outpaced instructional spending in every recent decade measured.
- The amenities arms race of the 2000s embedded luxury infrastructure costs that now flow directly to students through room and board fees.
- A family planning only for tuition — is planning for less than half of the problem.
SECTION 1: HOW WE GOT HERE—A DECADE-BY-DECADE ACCOUNT OF COLLEGE COSTS
To understand where college costs are going, you need to understand where they came from. The story is not a single straight line upward. It is a series of distinct eras, each driven by a different structural force—and each leaving behind a cost structure that persists to this day.
| 1940s-1970s | 1980s | 1990s | 2000s | 2010 → |
| The Affordable Era | Inflationary Decade | Bureaucratic Expansion | Amenities Battle | Cost of Living |
The Affordable Era: 1940s–1970s
The modern American university was built on an implicit social contract: government subsidizes higher education; students receive an accessible credential and a shot at the middle class. That contract held remarkably well through the postwar decades.
The GI Bill of 1944 supercharged enrollment without a corresponding tuition surge—federal dollars flowed directly to institutions. By the early 1970s, public university in-state tuition averaged $394 per year in nominal dollars. A student working a minimum-wage summer job could earn nearly double their annual tuition before the school year began. College was not free, but it was genuinely attainable on a working-class income.
The Higher Education Act of 1965 introduced federal student aid broadly, sowing seeds for a future ratchet effect—but in the 1960s, annual tuition inflation averaged only 5.33% before adjusting for economy-wide inflation, and the real (inflation-adjusted) cost of attendance grew modestly.
The Shock Era: 1980s—The Most Inflationary Decade in College History
The 1980s produced the most extreme tuition inflation of any decade on record. Public college tuition increased 141.3% in nominal terms. Private college tuition increased 160.3%. Community college tuition increased 113.1%. Nothing before or since has come close.
The primary driver was a structural shift in how public higher education was funded. As federal priorities shifted and state budgets tightened—particularly after the 1981-82 recession—state appropriations to public universities were cut sharply. Rather than shrink, institutions passed the cost directly to students through tuition increases.
A secondary driver was the feedback loop created by federal student aid. Economists call it the Bennett Hypothesis, named for Reagan-era Education Secretary William Bennett, who argued that universities raised tuition in direct proportion to increases in federal aid availability. Whether or not one accepts the full hypothesis, the correlation is difficult to dismiss: as federal loan limits expanded and Pell Grants grew, tuition followed with striking precision.
The 1980s also saw the beginning of administrative expansion. Between 1975 and 2005, the number of university administrators increased 85% while professional administrative staffers grew by 240%—compared to faculty growth of roughly 50%. The 1980s were the launching point for that divergence.
The 1980s Benchmark
Public college tuition increased 151.2% in the 1980s—the most inflationary decade in the history of American higher education. The primary driver: state funding cuts that forced institutions to shift the cost of education from taxpayers to students. Every subsequent decade of tuition inflation has built on the foundation laid in those ten years.
The Bureaucratic Era: 1990s—Administrative Expansion as a Cost Driver
By the 1990s, tuition inflation had moderated from its 1980s extreme, but costs continued to climb. The structural driver of the decade was not state funding or federal aid—it was the professionalization and expansion of university administration.
Benjamin Ginsberg, a political scientist at Johns Hopkins and author of The Fall of the Faculty, documents the transformation in precise terms: from 1975 to 2005, universities replaced faculty governance with professional management class. In 1975, colleges employed one administrator for every 84 students. By 2005, one for every 68 students. The ratio of professional staffers moved even more dramatically—from one for every 50 students to one for every 21. The spending ratio tracked the headcount: administrative spending per student rose approximately 60% in real terms from the early 1990s to the mid-2000s, outpacing growth in instructional spending by a wide margin.
Between 1993 and 2009, administrative positions at colleges and universities grew by 60%—ten times the rate of growth of tenured faculty positions, according to Department of Education data reported by Bloomberg.
The proportion of total university spending devoted to instruction fell from 41% in 1980 to 29% by 2021, while administrative and student-services spending held steady or grew as a share. Families were paying more each year, and less of that money was funding the classroom.
The Administrative Ratio
In 1975, colleges employed more faculty than administrators. By the mid-2000s, teachers made up less than half of all college employees. Administrative spending per student grew 60% in real terms from the early 1990s to the mid-2000s—directly outpacing instructional spending.
The Amenities Era: 2000s—Competing for Students with Infrastructure
The 2000s introduced a new and structurally embedded cost driver: the amenities arms race. As enrollment competition intensified and the college-earnings premium remained high, universities discovered that prospective students responded to facilities. Lazy rivers, climbing walls, state-of-the-art fitness centers, luxury residence halls, and expanded dining options became recruiting tools.
The consequence was permanent infrastructure debt. When a university builds a $40 million recreation center, it must service that debt for decades—and the cost flows to students primarily through room and board fees, not tuition. This is a critical distinction: the 2000s amenities binge created room-and-board inflation that would outlast the era that caused it.
The 2000s also saw the most rapid runup in public tuition of the post-1980s era, driven by the 2001 recession and its budgetary aftershocks. Between 2000-01 and 2012-13, inflation-adjusted tuition at public four-year institutions increased at nearly twice the rate as at private nonprofit four-years, as state appropriations collapsed and universities again turned to tuition as a substitute for state funding.
Between 1998 and 2008, private colleges increased spending on instruction by 22% while administrative spending grew by 36%—a pattern that continued throughout the decade across all sectors, as documented by the Delta Cost Project.
The Plateau Era: 2010s–2025—When Tuition Stopped Driving Affordability
Here is where the conventional wisdom breaks down—and where the most important insight for today’s parent lives.
Since 2010, inflation-adjusted tuition growth has nearly stopped. Total college tuition has increased 36.8% nominally since 2010, but after adjusting for inflation, that translates to just 0.92%—essentially flat across fifteen years. At public four-year universities specifically, in-state tuition has increased 36.7% nominally but only 0.86% in real terms. Net tuition—what families actually pay after grants and scholarships—peaked in 2012-13 and has been declining since, reaching an estimated $2,300 in 2025-26 at public four-year schools (down from a 2012-13 peak of $4,450 in 2024 dollars).
The Federal Reserve Bank of Richmond confirmed this trend in a 2024 analysis: tuition growth slowed markedly from 2010 to 2022, driven by slower income growth, a flattening of the college-earnings premium, flat federal loan limits since 2008, and increased state funding that recovered from the 2008 recession lows.
The College Board’s 2025 report stated plainly: ‘Over the last 10 years, average tuition and fees in the public sectors increased less than inflation.’
Yet families feel less affordable than ever. Why?
Room and board rose 14% more than inflation between 2010 and 2020 (or 1.3% / year above inflation). At public universities, in-state students now pay more for room and board than for tuition. The college affordability conversation has been looking at the wrong line item.
The answer: room and board. The Hechinger Report, the College Board, and the Urban Institute all document the same phenomenon—housing and food costs at colleges rose 14% more than inflation between 2010 and 2020. Since the pandemic, student housing rents have grown at 5% annually versus 2.5% for the broader rental market. At public universities, in-state students now pay more for room and board than for tuition. For community college students, housing and food account for 51% of their total budget—while tuition is only 20%.
The affordability crisis did not end. It migrated from Tuition to Cost of Living.
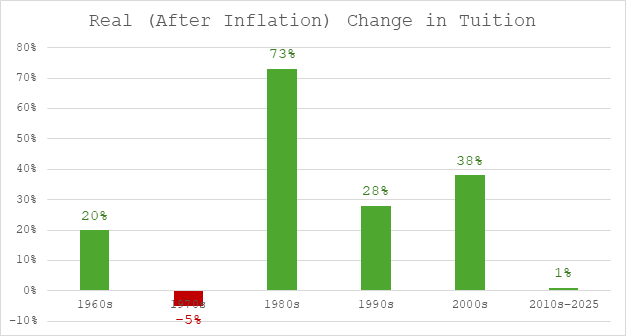
Growth in Tuition by Decade:
| Nominal Change | Real Change | Primary Driver | |
| 1960s | +53% | ~+20% | Enrollment growth; strong state subsidy |
| 1970s | +65% | –5% | High CPI inflation masked real flat cost |
| 1980s | +152% | +73% | State funding cuts; Bennett Hypothesis |
| 1990s | +71% | +28% | Administrative expansion; aid growth |
| 2000s | +79% | +38% | Recession-driven cuts; amenities arms race |
| 2010s–2025 | +37% | +1% | Tuition plateau; room & board accelerating |
SECTION 2: THE CORE ARGUMENT—TUITION VS. COST OF LIVING
This section makes the argument that, for most families planning today, the more consequential question is not ‘how do I pay for tuition?’ but ‘how do I pay for four years of adult life that happen to coincide with college attendance?’
This reframing is not rhetorical. It has practical and financial consequences for every decision a family makes: where to invest, what insurance to carry, and how to think about student loans.
Where the Money Actually Goes
The total cost of attending college for a full-time undergraduate in 2024-25 ranges from approximately $20,570 (public two-year, in-district) to $62,990 (private nonprofit four-year), according to College Board data. Those totals include tuition and fees, housing, food, books, transportation, and personal expenses.
At public four-year universities—the most common destination for American undergraduates—in-state students face average total budgets of approximately $29,910. Of that:
- Tuition and fees: approximately $11,610 (39% of total)
- Room and board (housing + food): approximately $12,770 (43% of total)
- Books, transportation, personal: approximately $5,530 (18% of total)
That means 61% of the total college cost at the average public university has nothing to do with the classroom. It is the cost of being a person in the world.
The Life Expense Insight
Here is the question that changes everything: What would an 18-22 year old pay for housing and food if they did not attend college?
According to Zillow, the average 12-month rental in the U.S. costs approximately $24,888 per year—more than on-campus room and board at most public universities. The USDA’s Thrifty Food Plan estimates a monthly grocery budget of $247 to $317 for a consumer aged 18 to 50. A young adult working a job after high school, living in a shared apartment, buying groceries, and paying utilities incurs costs that are structurally identical to—and often higher than—the room-and-board line item on a college financial aid award letter.
The practical conclusion: the housing and food component of college is not a college expense. It is a life expense that a family must plan for regardless of whether their child attends college. The only true college-specific expense is tuition, fees, and direct educational costs.
A family whose child attends college pays for tuition AND for four years of life. A family whose child does not attend college still pays for four years of life.
The Numbers in Practical Terms
Consider a family with a child entering a public four-year university in-state in 2038 (13 years from now), with current tuition at approximately $11,610 and total COA of approximately $29,910. Using historical inflation rates (4.5% for public four-year tuition, somewhat higher for housing), projected four-year costs look approximately like this:
| Total 4-year net price (tuition + fees, projected), approximately 40% of the TCOA | $57,000–$68,000 |
| Total 4-year housing + food (projected), approximately 60% of the TCOA | $70,000–$90,000 |
| Combined 4-year total: | $130,000–$160,000 |
What People Usually Get Wrong
The standard college-planning recommendation is: open a savings account, invest in an age-based target fund, and add to it monthly. This is not wrong. It is incomplete.
The conventional approach has three structural gaps that this white paper argues must be addressed:
- Gap 1: The savings vehicle. A target-date fund historically returns approximately 4.5% annually. Over 13 years, reaching a $100,000 target requires monthly contributions of approximately $430. The same target reached with an S&P 500 index fund (11% historical return) requires approximately $190 per month. A direct index fund with tax-loss harvesting and +1.3% alpha over the S&P 500 (historically back-tested) requires even less. The investment vehicle matters enormously over a multi-decade savings window.
- Gap 2: The catastrophe risk. If the primary earner dies before the child enrolls, the savings contributions stop and may be insufficient to cover costs. If the child takes out private student loans and the family suffers a loss after graduation, the loan obligation does not disappear. Dual-phase term life insurance—sized to cover college costs in phase one and loan repayment in phase two—closes this gap. Most college savings plans do not address it.
- Gap 3: The loan strategy. Most families assume that borrowing is a last resort and repayment is a post-graduation problem. In reality, for many middle-income families, borrowing strategically and managing the loan through an investment vehicle is mathematically superior to cash-funding the entire cost of attendance. The terms of the loan matter as much as the loan balance. A 0.25% rate reduction, 1.5% cash back to the borrower, and a preferred underwriting tier—available only to members of a negotiating collective—can represent thousands of dollars in lifetime savings.
Why This Matters for Financial Advisors and College Planning Professionals
The objection that arises most frequently from advisors, academics, and college planning consultants is some version of: ‘But tuition has tripled since the 1980s—it is clearly the cost that matters.’ This objection has three flaws.
First, the relevant comparison is not 1980 to 2026—it is today to 2038, or whenever the child in front of you will enroll. The real trajectory of tuition over the past 13 years is essentially flat. Projecting 1980s-era tuition inflation into future scenarios produces materially overstated cost estimates that mislead families into either over-saving in the wrong vehicle or abandoning the planning process as hopeless.
Second, even accepting the long historical average as a forward projection, the analysis remains incomplete if it ignores the cost-of-living component, which has now surpassed tuition as the dominant line item for most families.
Third, the question is not whether college costs have risen—they have. The question is what a family should do about it in 2026. An advisor who focuses exclusively on 529 plan optimization while leaving insurance, loan strategy, and investment vehicle selection on the table is not solving the whole problem.
For Advisors Who Want to Debate This
The data in this white paper comes from: College Board (Trends in College Pricing, 2024 and 2025 editions), Federal Reserve Bank of Richmond (July 2024), EducationData.org (citing NCES/IPEDS), the Urban Institute, The Hechinger Report, and Benjamin Ginsberg’s The Fall of the Faculty (Johns Hopkins University Press, 2011). All claims are sourced and cited in the appendix. The argument is not that college is affordable. It is that the affordability problem has migrated—and that the planning response must follow it.
SECTION 3: PRACTICAL COST REDUCTION STRATEGIES
If the cost of living is now the dominant college expense, the most powerful cost-reduction strategies are those that address living costs directly—not just tuition. This section examines six strategies that can meaningfully reduce total four-year expenditure, along with a frank assessment of the tradeoffs involved.
These are not presented as universal recommendations. They are presented as options that financially literate families should be aware of and evaluate—exactly the kind of analysis that a fiduciary advisor should be providing.
Strategy 1: Off-Campus Housing After Year One
The dominant narrative of campus life assumes that freshmen live in dormitories—which they often must—and that upperclassmen continue to do so for the community and convenience. The data suggests the financial case for this assumption is weak.
University of California-Berkeley estimates that new students who live off campus pay up to 10.6% less than students in on-campus residence halls. Nationally, average on-campus room and board runs approximately $12,770 per year. Average off-campus rent for a shared two-bedroom apartment can be materially lower, depending on the market.
Over three years of upper-division enrollment, a family that transitions to off-campus housing in year two—sharing a two-or three-bedroom apartment with peers—can meaningfully reduce housing costs, while also gaining control over food expenditure (cooking versus mandatory meal plans).
The social objection: Genuine friendships do not require cohabitation. High school students form lasting relationships without living together. College students can do the same—and often choose their own roommates in junior and senior years, creating the same peer bonding that dormitory advocates ascribe to required on-campus living. Employers do not evaluate a candidate’s undergraduate living arrangement.
Strategy 2: Opting Out of the Mandatory Meal Plan
Most universities require freshmen to purchase a meal plan as a condition of on-campus housing. These plans typically run $5,000 to $6,000+ annually. For students who move off campus, the meal plan requirement generally disappears.
The USDA Thrifty Food Plan estimates that a consumer aged 18-50 can eat on approximately $247 to $317 per month if purchasing and preparing their own food—approximately $2,970 to $3,800 per year. Even a moderate food budget of $400 per month represents $4,800 annually—still below the average mandatory meal plan.
The difference over three years of off-campus living: $3,000 to $6,000+ in cumulative savings on food alone, while also building the practical life skills that come with cooking and food budgeting. This is not frugality—it is basic financial literacy applied to a specific cost category.
Strategy 3: The Resident Advisor Route
Many universities offer students the opportunity to apply for Resident Advisor (RA) positions after their freshman year. RA roles come with free or heavily subsidized room and board in exchange for supervising a dormitory floor, organizing events, and serving as a resource for younger residents.
At many institutions, an RA receives free room and meal plan—a benefit worth $12,000 to $16,000 or more per year. Over two years of RA service, this represents $24,000 to $32,000 in direct cost elimination.
The tradeoff is real: RA service requires time, availability, and a personality suited to conflict resolution and community management. It is not right for every student. But for a student who has the temperament for it, there is no other single strategy that eliminates more cost more directly.
Strategy 4: Health Insurance Waiver
Most universities automatically enroll students in a campus-sponsored health insurance plan, adding $2,700 to $6,000+ to annual costs. Most institutions also allow students to waive this plan if they can demonstrate coverage under a parent or guardian’s policy.
Under the Affordable Care Act, dependent children can remain on a parent’s health insurance plan until age 26. For a student who enters college at 18, that means all four years of undergraduate study are covered under the family’s existing plan—at no additional premium cost to the student.
Filing a health insurance waiver requires documentation and attention to deadlines, but for families with existing coverage, it is one of the simplest and highest-value cost reductions available. Over four years, eliminating the campus health insurance charge can save $11,000 to $24,000.
Strategy 5: The Community College Pivot
For families in which the specific four-year institution is flexible, the two-year community college path deserves serious consideration—not as a fallback, but as a financially rational strategy.
Net tuition at public two-year colleges has been effectively zero for most students since 2009-10: on average, first-time full-time students receive enough grant aid to fully cover tuition and fees. The College Board’s most recent data confirms that community college students have received negative net tuition for years—meaning grant aid exceeds tuition charges and helps offset other costs as well.
A student who completes two years at a community college and transfers to a state university for two years of upper-division coursework pays approximately the same credential—a four-year bachelor’s degree from the state institution—at dramatically reduced cost. The four-year cost for this student may be $40,000 to $60,000 less than a student who completes all four years at the state university.
The legitimate objection: not all institutions have seamless transfer agreements, and the social experience of freshman year at a four-year institution has documented retention benefits. But for families for whom the financial case is paramount, the community college pathway deserves an honest seat at the planning table.
Strategy 6: Living at Home
For students who attend a college or university within commuting distance of home, living with parents for some or all of their college years is among the most powerful cost-reduction strategies available. Room and board is the largest single non-tuition expense in a college budget—averaging $12,000 to $15,000 per year at four-year institutions—and it is the one expense that can be reduced to near zero through a deliberate housing decision.
A student who lives at home for the first two years of college avoids an estimated $24,000 to $30,000 in room and board costs—money that would otherwise be financed through loans, savings, or parent income. Even accounting for commuting costs, the net savings are substantial. For families in metro areas with strong regional university options, this decision alone can reduce total four-year borrowing by 20 to 30 percent.
This strategy pairs naturally with the community college pivot described in Strategy 5: a student who completes two years at a local community college while living at home, then transfers to a four-year institution for upper-division coursework, captures both the tuition reduction and the room-and-board reduction simultaneously. The combined effect can reduce four-year total costs by $60,000 to $90,000 compared with four years of on-campus living at a state university.
The legitimate tradeoff is social: the residential campus experience—the friendships, independence, and immersive environment that many families associate with college—is partially forgone. For some students, this tradeoff is unacceptable; for others, especially those in their late teens who are comfortable maintaining a strong social life from a home base, the financial benefit far outweighs the cost. The decision is personal, but it should be made with the full financial picture in view, not as an afterthought.
What These Strategies Have in Common
| Cost Reduction Strategy | Estimated 4-Year Savings |
| Off-campus housing (years 2-4) | $4,000–$12,000 |
| Opt out of meal plan (years 2-4) | $3,000–$6,000+ |
| Resident Advisor position (2 years) | $24,000–$32,000 |
| Health insurance waiver (all 4 years) | $11,000–$24,000 |
| Community college pivot (2 years) | $40,000–$60,000+ |
| Live at home for first 2 years | $24,000–$30,000 |
SECTION 4: WHAT A REAL PLAN LOOKS LIKE
The diagnosis of the problem—a mixed tuition-and-living-cost challenge that existing savings vehicles address only partially—points toward a prescription. A complete college plan must address five dimensions:
- The investment: Saving toward a target in a vehicle that maximizes after-tax return over the savings horizon.
- The catastrophe: Insurance that guarantees plan continuity regardless of what happens to the primary earner.
- The debt: A loan strategy that is designed in advance, not improvised at tuition-billing time.
- The terms: A mechanism for negotiating better loan terms through collective purchasing power rather than accepting whatever the market offers a single borrower.
- The advisor: A fiduciary who manages all five dimensions coherently over a decade-plus relationship.
Most families have one of these five. Some have two. Very few have all five, and the ones who do typically discover the remaining gaps only when the bill arrives.
This is the gap that Kiddos Capital was designed to close. Not by replacing the savings vehicle, but by building a membership platform that integrates all five dimensions under a fiduciary roof—reaching families before kindergarten, when there is still enough time for compounding to do meaningful work.
The Investment Vehicle Question
| To Save $100K by Enrolling in College | Investment |
| Enrollment Date Target Fund / month | $430 |
| Direct Index with TLH / month | $147 |
| Difference / month ($) | $283 |
| Difference / month (%) | 192% |
| Total Difference | $44,148 |
The Loan Strategy Question
The average student loan borrower leaves school with approximately $29,000 in federal loans and the parents borrow an additional ~$60,000.
There are two main sources of loans for students and parents: Federal Loans and Private Loans.
There is an important difference in the application process. The college will facilitate the Federal Loan applications because it is standardized and there is virtually no risk of being turned down for the legislated amount. On the other hand, the students and parents must apply directly for a private loan. Because the lender is looking at credit risk, the process is a bit more complicated and varies between lenders.
The cost of Federal and Private loans can vary substantially as well. The federal amounts are legislated and published annually on July 1st à No opportunity to negotiate. The private loan rates can vary quite a bit depending on creditworthiness.
| Federal Loans | Private Loans | ||
Origination Fees | 1.057% 4.228% | Federal Direct Unsubsidized Loan Parent PLUS Loans. | 0% No Fees | |
Interest Rate | 6.39% 7.94% 8.94% | Direct Unsubsidized (undergrad): Direct Unsubsidized (grad): Parent PLUS | 2.69% – 15.86% 2.84% – 17.99% 2.89% – 17.49% 3.23% – 15.99% | Ascent College Ave Sallie Mae SoFi |
The terms of those loans are rarely negotiated. A single family approaching a lender has no leverage. However, a collective of 1,000 families approaching the same lender with $50 million in projected borrowing has substantial leverage.
To illustrate what collective leverage produces in practice: a student loan aggregation platform, negotiated terms on behalf of its members that included 2% cash back on new undergraduate and parent loans, and rates that are at least 0.25% (undergraduate) to 1.6% (graduate students) below market. For an undergraduate, on a $50,000 loan over 10 years, a 1.5% cash-back payment at disbursement represents $750 immediately; a 0.25% rate reduction saves approximately $670 over the life of the loan. A family acting alone cannot negotiate either benefit.
The mortgage market also has examples of membership organizations negotiating advantageous terms for its members.
Example of Smart Borrowing to Buy a Home
- Scenario 1: You approach a traditional lender to get the best rate for an individual.
- Scenario 2: You have joined a membership organization, like a Credit Union, Labor Union, for example. These membership organizations negotiate with banks so that they can offer better rates to their members.
| Cost | Traditional Bank | Membership Program | Typical Difference |
| Origination Fee | 0.5% to 1% of loan amount | May be 0% or a flat, reduced fee | $1,500 – $3,000 savings on a $300k loan |
| Interest Rate | Market-standard (e.g., 6.84%) | Often 0.1% to 0.5% lower | $20 – $100+ savings / month |
| Closing Costs | 2% to 5% of purchase price | Often at the lower end or subsidized | $1,000 – $5,000+ total savings |
| Private Mortgage Insurance (PMI) | Required if down payment < 20% | Specialized programs may require $0 PMI | $100 – $300+ savings / month |
A Member could save $60,000 - $80,000 over the life of a $300,000 mortgage.
The same benefits are possible for college
The Case for Beginning at Birth
The most powerful variable in any savings plan is time. A family that begins saving when the child is born has 18 years for compounding to work. A family that begins when the child is 10 has 8 years. The difference in required monthly contribution for the same target is not linear—it is dramatically nonlinear because of compound growth.
Every other financial services provider in the college planning space meets families at a specific trigger: when they open a saving plan (typically age 3 to 5), when they search for schools (typically age 15 to 16), or when the tuition bill arrives. None meets them at birth.
SECTION 5: CONCLUSION AND CALL TO ACTION
The college affordability conversation in America has been dominated for forty years by a single narrative: tuition is rising out of control, families cannot keep up, and the solution is to save more in a 529 plan. That narrative was accurate in the 1980s. It is increasingly misleading in 2026.
The data is clear: inflation-adjusted tuition at public universities has been essentially flat for fifteen years. Net tuition—what families actually pay after grants—peaked in 2012-13 and has been declining. The fastest-growing cost of college is room and board, which rose 14% more than inflation in the last decade and now exceeds tuition as the single largest expense at public universities.
And housing and food, unlike tuition, is a cost that every 18-to-22-year-old incurs—whether they attend college or not. It is a life expense, not an educational expense. Conflating the two produces a misdiagnosis of the problem and, consequently, a misdirected solution.
The implications for families are significant. The cost-saving strategies in Section 3 are not tips and tricks—they are structural decisions that can reduce total four-year expenditure by $30,000 to $100,000 or more. The integrated planning approach in Section 4 is not a product pitch—it is a description of what a complete plan must include in order to address the whole problem.
For financial advisors, academics, and college planning professionals who challenge this framework: the data is sourced, the argument is empirical, and the conclusion is testable. Families deserve a conversation that starts with the full picture—all five dimensions of cost, risk, and strategy—not just the dimension that existing products happen to address.
The question is not whether college is expensive. It is. The question is whether the planning industry has caught up to the actual structure of that expense—or whether it is still fighting the last war.
For Families Reading This
If you have a child under 10 years old, you have more planning runway than any financial product is designed to exploit. The decisions you make in the next one to three years—investment vehicle, insurance structure, loan strategy—will compound over the next 10 to 18 years before college and impact the 10 – 20 years after graduation.
The families who finish college with the least stress are not the ones who saved the most. They are the ones who built the most complete plan the earliest.
APPENDIX: SOURCES AND METHODOLOGY
All statistical claims in this white paper are drawn from the following primary and peer-reviewed sources. Where ranges are presented, the methodology is noted.
Tuition and Cost of Attendance Data
- College Board, Trends in College Pricing and Student Aid 2024 (published October 2024) and 2025 (published October 2025). Primary source for net tuition figures, total cost of attendance by sector, and decade-over-decade inflation comparisons.
- National Center for Education Statistics (NCES), Integrated Postsecondary Education Data System (IPEDS), 2023-24 academic year data. Used for institution-level tuition, room and board, and financial aid figures.
- EducationData.org, ‘College Tuition Inflation Rate’ (updated November 2025), citing NCES/IPEDS data and Bureau of Labor Statistics Consumer Price Index for college tuition and fees.
- EducationData.org, ‘Average Cost of College by Year’ (updated September 2025). Source for decade-by-decade nominal tuition statistics.
- BestColleges Research, ‘Cost of College Every Year Since the 1960s’ (updated February 2025), citing NCES data for long-run tuition in constant dollars.
Room and Board / Cost of Living
- College Board, Trends in College Pricing 2024: Table CP-2, ‘Average Tuition and Fees and Housing and Food in 2024 Dollars, 1994-95 to 2024-25.’ Source for room-and-board-versus-tuition comparison and 14% real growth figure (2010-2020).
- The Hechinger Report, ‘The fastest-growing college expense may not be what people think’ (August 2024). Primary reporting on room-and-board growth.
- https://www.urban.org/sites/default/files/publication/87911/five_facts_about_living_costs_0.pdfUrban Institute, ‘Five Facts about the Sharp Rise in College Living Costs.’ Analysis of IPEDS housing data showing room charge increases outpacing general inflation.
- Center for American Progress, ‘The Full Cost of Attendance’ (July 2025). Source for community college budget breakdown (housing at 51% of total budget).
- EduvationData.org, ‘Average Cost of College’ (2026). Source for on-campus vs. off-campus housing cost comparisons, including UC-Berkeley 10.6% figure.
- USDA Thrifty Food Plan, Monthly Food Plans at Four Cost Levels (2025). Source for grocery budget ranges for 18-50 year olds.
- Zillow Research, U.S. Rental Market Data (2025). Source for average 12-month rental cost ($24,888/year).
Administrative Growth and Spending
- Benjamin Ginsberg, The Fall of the Faculty: The Rise of the All-Administrative University and Why It Matters. Johns Hopkins University Press, 2011. Source for administrator-to-student ratio changes, 1975-2005, and faculty vs. administrative growth statistics.
- Delta Cost Project, 2010. Source for 1998-2008 instructional spending (+22%) vs. administrative spending (+36%) comparison at private colleges.
- American Council of Trustees and Alumni (ACTA), ‘If You Give an Administrator an Assistant’ (2019) and HowCollegesSpendMoney.com. Source for 2010-2018 spending trends.
- U.S. News & World Report, citing Bloomberg and Department of Education data: administrative positions grew 60% from 1993-2009, 10x the rate of tenured faculty.
- U.S. News & World Report, ‘One Culprit in Rising College Costs: Administrative Expenses’ (June 2023). Source for instruction-share-of-spending decline from 41% (1980) to 29% (2021).
Federal Reserve and Economic Analysis
- Federal Reserve Bank of Richmond, ‘Tracking College Tuition Growth,’ Economic Brief No. 24-23 (July 2024). Source for tuition growth slowdown from 2010 to 2022, and analysis of contributing factors.
- Georgetown Center on Education and the Workforce, ‘If Not Now, When?’ (2021). Source for 169% college cost increase vs. 19% wage increase from 1980-2019.
- Bipartisan Policy Center, ‘What Has Happened to College Prices?’ (October 2025). Source for net tuition trends across sectors and state appropriations analysis.
- Richmond Fed citing NCES Digest of Education Statistics, Table 333.40 (January 2024). Federal student loan limit data.
Student Loan Market
- Juno (now Splash Financial) published rate and cash-back data, as analyzed and documented in Kiddos Capital’s Juno Loan Discount Analysis (February 2026). Figures used for lender negotiation benchmarking.
- College Board, Trends in Student Aid 2024-25: Total annual borrowing figures and 13-consecutive-year decline in undergraduate borrowing.
Historical Tuition (1960s-1980s)
- Intelligent.com, ‘1970 vs. 2020: How Working Through College Has Changed’ (October 2023), citing NCES. Source for 1970-71 public in-state tuition ($394) and 2020-21 figure ($10,560).
- BLS Consumer Price Index for College Tuition and Fees (1977-2026). Source for 5.92% average annual tuition inflation since 1977.
- Investment Company Institute and College Savings Plans Network, 529 Plan Program Statistics, December 2024 (published April 10, 2025). Source for total 529 account count (17.0 million at end of 2024, up 3.24% from year-end 2023) and total assets ($525.1 billion). The 800,000 annual new-account estimate used in this paper is derived as follows: net account growth of approximately 530,000 in 2024, plus an estimated 325,000 accounts closed during the year (assuming a 2% annual close rate on the 16.47 million accounts outstanding at year-end 2023). ICI and CSPN do not separately publish gross new openings or gross closures; this close-rate assumption is the authors’ own estimate. Data compiled jointly by ICI and CSPN.
Sources for Inflation by Decade:
- EducationData.org citing NCES/IPEDS; BestColleges citing NCES constant-dollar data; BLS CPI for college tuition. Blended average weights public 4-year (58% of enrollment) and private nonprofit 4-year (42%).
References for Mortgage Information
- Federal Oversight Data (NCUA): The National Credit Union Administration provides quarterly comparative reports. As of late 2025/early 2026, the national average for a 30-year fixed-rate mortgage at a credit union was 6.74%, while commercial banks averaged 6.84%.
- Program Specific Documentation (NACA): According to the NACA Purchase Workbook, the “Best in America” mortgage removes the four primary financial barriers: down payments, closing costs, fees, and credit score requirements.
- Market Surveying (Freddie Mac/Zillow): Industry studies by Freddie Mac and surveys by Zillow identify the origination fee as the most common “unexpected” fee, typically ranging from 0.5% to 1%.
- National Credit Union Administration (NCUA), Credit Union and Bank Rates, Q2 2025. Source for interest rate benchmarks: national average 30-year fixed-rate mortgages are 0.10%–0.30% lower at credit unions than at commercial banks. As of late 2025/early 2026, credit union average: 6.74% vs. 6.84% for commercial banks. NCUA: Credit Union and Bank Rates 2025 Q2
- Rocket Mortgage, ‘Loan Origination Fee Data’ (2024). Source for origination fee benchmarks: fees range from 0.5% to 1.2% of loan amount, 2024 average $3,822. Rocket Mortgage: Loan Origination Fee Data
- Neighborhood Assistance Corporation of America (NACA), NACA Purchase Workbook. Source for no-down-payment, no-closing-cost, no-PMI mortgage product. NACA: Neighborhood Assistance Corporation of America FAQ
- Homes for Heroes, Official FAQ and Savings Reports (2025). Average total member savings of $3,000 per transaction, including $500 average lender fee reduction. Homes for Heroes: Official FAQ & Savings Reports
- Union Plus, Wells Fargo Mortgage Program (2025). Source for post-closing cash incentives and hardship grant benefits for eligible union members. Union Plus: Wells Fargo Mortgage Program
- Freddie Mac, ‘Cost to Originate Study’ (2024). Industry-wide origination cost benchmarks; 2024 average per-loan cost for retail lenders approximately $11,600. Freddie Mac: 2024 Cost to Originate Study